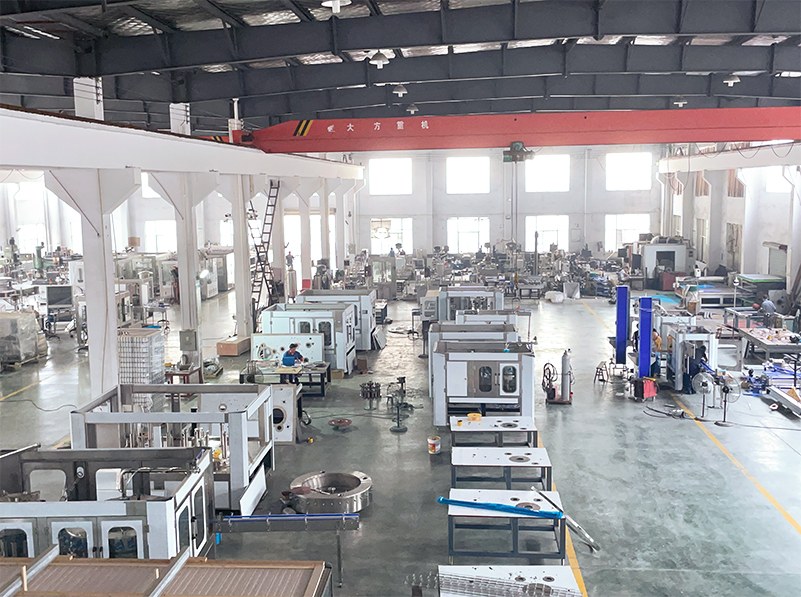
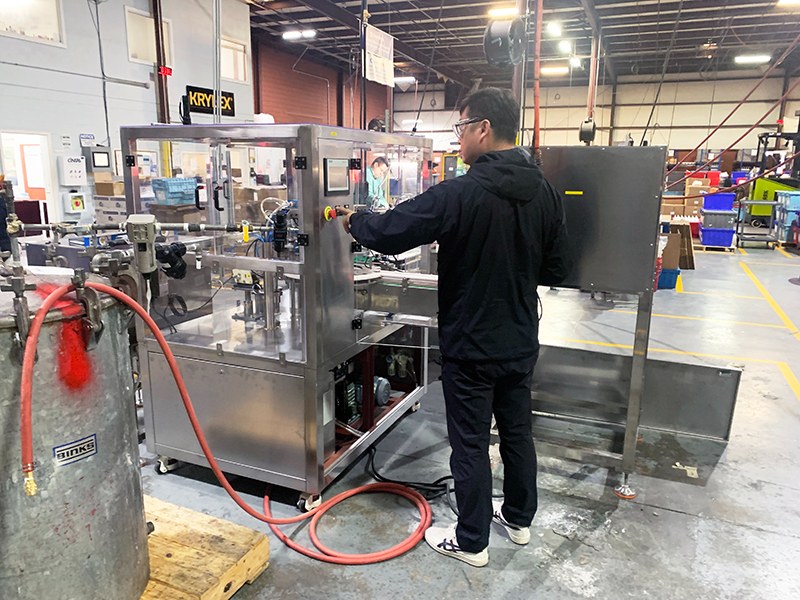
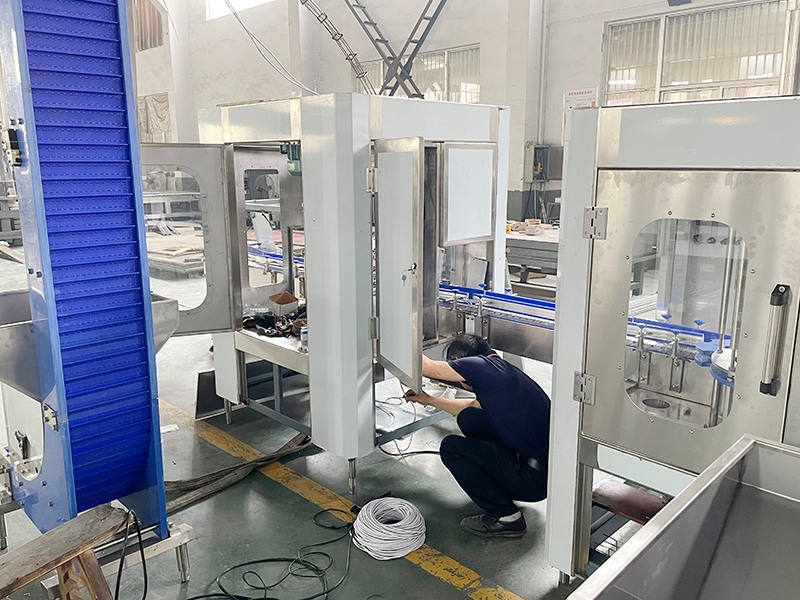
A useful bottled water production cost estimate has three layers: landed and installed project cost, recurring plant operating cost, and saleable bottles produced under the planned schedule. Packaging, utilization, treatment recovery, utilities, labor, changeovers, rejects, maintenance, and distribution assumptions can change the result more than a small difference in filler price.
This guide provides a worksheet structure for current quotations and site data. The resulting cost per bottle is project-specific because supplier prices, packaging markets, wages, utility tariffs, duties, freight, interest rates, water quality, and regulations vary by location and date.
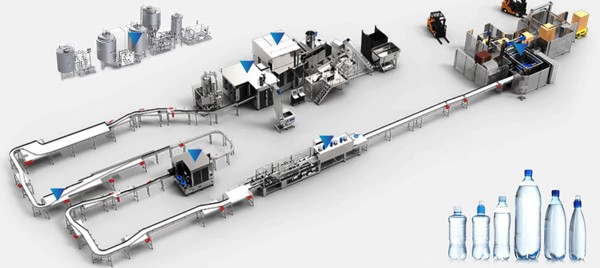
Figure 1. Cost the complete flow from water treatment and bottle supply through packing and pallet handling, not only the filler. Source: MIC Beverage Machine.
Four calculations set the cost model
Use four calculations:
- Landed project cost = equipment + options + tooling + freight + duties and taxes + local transport
- Installed project cost = landed project cost + civil work + utilities + interconnections + installation + commissioning + validation + startup inventory
- Period operating cost = packaging + raw and process materials + utilities + direct labor + maintenance + quality + sanitation + waste + allocated overhead
- Production cost per saleable bottle = period operating cost / saleable bottles released in the same period
Keep financing, depreciation, sales, marketing, outbound distribution, and corporate overhead in separate lines. Management can then see the factory conversion cost, full manufacturing cost, and delivered commercial cost without mixing them.
Define the costing boundary before collecting prices
Two projects described as "a 5,000 BPH water line" can contain different assets and responsibilities. One quote may cover only rinsing, filling, and capping. Another may include water treatment, PET blowing, labeling, packing, conveyors, installation supervision, and spare parts. Neither total is comparable until the boundary is normalized.
Start with a process and responsibility map:
|
Cost boundary
|
Include
|
Common omissions to check
|
|
Source and treatment
|
Source development or connection, raw-water storage, treatment skids, treated-water storage, distribution, instruments, chemicals, and reject-water route
|
Laboratory analysis, pumps, tanks, piping, drains, waste handling, commissioning media
|
|
Bottle supply
|
Purchased bottles and storage, or preforms, blower, molds, air system, cooling, and bottle conveying
|
Mold validation, high-pressure compressor, dryer, receiver, chiller, preform handling, bottle tests
|
|
Filling block
|
Infeed, rinsing, filling, cap feeding, capping, guarding, controls, and cleaning connections
|
Cap elevator, change parts, cleaning skid, product piping, rejected-container handling
|
|
Downstream
|
Drying, coding, labeling, inspection, conveying, packing, palletizing, and pallet wrapping
|
Ink or laser extraction, label change parts, film or carton trials, checkweigher, pallet magazine
|
|
Factory and utilities
|
Floors, rooms, drains, electrical distribution, water, air, cooling, ventilation, fire and safety systems
|
Utility generation, pipe and cable trays, earthing, condensate, effluent, local approvals
|
|
Project execution
|
Engineering, FAT, freight, insurance, duties, unloading, installation, commissioning, training, validation, and handover
|
Travel, visas, local labor, lifting, temporary utilities, translation, consumables, repeat tests
|
Use the current MIC water filling line page as one equipment-scope reference. It presents treatment, bottle blowing, rinsing-filling-capping, drying, labeling, coding, secondary packing, palletizing, and pallet wrapping. Treat those modules as a checklist, not as proof that every item is included in a particular quotation.
Separate capital cost from operating cost
Capital expenditure creates or upgrades the production asset. Operating expenditure is consumed by producing, cleaning, maintaining, and supporting it. Some items require an accounting decision: major replacement parts, molds, building modifications, commissioning batches, and startup spares may be capitalized or expensed under the company's policy and applicable rules. Keep the engineering estimate detailed enough for finance to classify it later.
Capital cost categories
- process, treatment, filling, labeling, packing, inspection, and material-handling equipment;
- molds, change parts, tooling, laboratory instruments, workshop tools, and initial spare parts;
- compressors, receivers, dryers, chillers, boilers or heaters, pumps, tanks, electrical panels, and backup power where required;
- building purchase or leasehold work, hygienic rooms, foundations, floors, drains, ventilation, and warehouse fit-out;
- engineering, project management, FAT, shipping, insurance, import charges, local transport, unloading, installation, commissioning, and training;
- permits, professional services, validation, initial testing, and startup materials where applicable.
Operating cost categories
- preforms or purchased bottles, caps, labels, film, trays, cartons, pallets, and stretch film;
- source water, treatment chemicals, filter media, membrane-related consumables, sanitation chemicals, and cleaning supplies;
- electricity, water, compressed air, cooling, heating, ventilation, lighting, and waste or effluent handling;
- operators, technicians, quality staff, supervisors, warehouse labor, cleaning, and payroll-related costs;
- planned maintenance, wear parts, lubricants, calibration, external service, breakdown parts, and technical support;
- laboratory tests, retained samples, pest control, hygiene consumables, rejects, rework, waste, and product disposal;
- rent, insurance, security, administration, and other site overhead allocated under the company's costing policy.
Packaging is a line-by-line calculation
For single-use PET water, packaging is not one cost. Build a bill of materials for each SKU and final pack.
|
Packaging item
|
Cost input
|
Usage basis
|
Losses to include
|
|
Preform or finished bottle
|
Supplier quotation by specification and quantity
|
One per filled unit
|
Blow-molding rejects, damaged bottles, incoming defects, setup samples
|
|
Cap
|
Cap and liner specification, color, decoration, order quantity
|
One per bottle
|
Feeder rejects, torque tests, damaged caps, line clearance
|
|
Label
|
Material, print, adhesive or sleeve, artwork, roll length
|
One per bottle
|
Web breaks, changeover waste, inspection rejects, obsolete artwork
|
|
Date or lot code
|
Ink, solvent, ribbon, labels, laser consumables or extraction
|
Per printed unit or operating hour
|
Setup, cleaning, maintenance, rejected prints
|
|
Secondary pack
|
Film, tray, carton, divider, handle, tape or adhesive
|
Per defined pack count
|
Machine setup, damaged packs, transport-test samples
|
|
Pallet load
|
Pallet, top sheet, corner board, stretch film, straps
|
Per pallet pattern
|
Damaged pallets, wrapping setup, warehouse loss
|
Calculate packaging cost per saleable bottle from the actual pack structure. If a carton holds 24 bottles, divide the carton, tape, label, pallet allocation, and stretch-wrap cost by the accepted bottles in that pack and pallet. Filler output before rejects is the wrong denominator.
Bottle light-weighting or a cheaper cap produces a saving only after the revised package passes blowing, filling, capping, labeling, packing, stacking, transport, opening, and shelf-life checks. Include mold or change-part cost, trials, line adjustment, and any increase in damage.
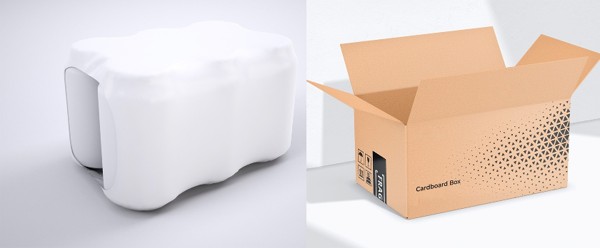
Figure 2. Secondary packaging cost follows the chosen bundle, carton, pallet pattern, and transport requirement. Source: MIC Beverage Machine.
Water treatment cost starts with feed-water data
Raw water may be inexpensive, but treatment scope and usable recovery depend on its quality, seasonal variation, finished-water target, and local discharge conditions. Cost the complete mass balance: feed water, product water, filter backwash, membrane concentrate where applicable, sanitation water, bottle rinsing, floor cleaning, and laboratory sampling.
Treatment operating costs can include pumping power, filter media, activated carbon, salt, membrane cleaning chemicals, replacement elements, ultraviolet lamps, ozone-related equipment, instrumentation, calibration, wastewater handling, and operator time. Assign reverse osmosis or another process only when the source analysis, product category, and finished-water target justify it.
The current WHO Guidelines for drinking-water quality use a risk-management framework from catchment to consumer. For bottled water outside the natural-mineral-water category, the Codex hygienic code CXC 48-2001 says source composition and microbiological safety should be established over an appropriate period and treatments should be controlled. These principles support budgeting for testing, monitoring, sanitation, and waste handling rather than pricing only the treatment skid.
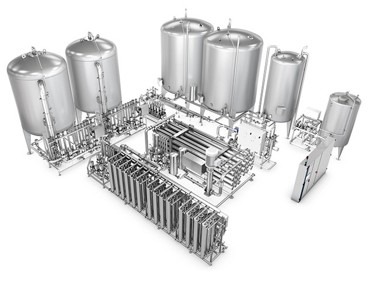
Figure 3. Water-treatment cost depends on the source analysis, target specification, monitoring, cleaning, and waste streams. Source: MIC Beverage Machine.
Calculate utilities from equipment demand and operating hours
Ask each supplier for connected load, expected running demand, peak demand, pressure, flow, temperature, quality, and operating state for every utility. Then build an hourly and period model.
Electricity cost for a period = sum of equipment operating kW × operating hours × local tariff, adjusted for the tariff structure
The formula needs separate operating states where consumption changes during production, standby, cleaning, changeover, and shutdown. Demand charges, time-of-use tariffs, power-factor penalties, generator fuel, and transmission charges may need separate lines depending on the site.
Compressed-air cost should be based on the complete system. PET blow molding can require a high-pressure circuit in addition to service or instrument air. Include compressor power, dryers, filters, cooling, condensate management, storage, pressure losses, leaks, maintenance, and part-load control. The U.S. Department of Energy's compressed-air systems resources include tools for assessing controls, storage, air quality, leaks, and plant operating cost.
Water, cooling, heating, and ventilation should be modeled the same way: a defined flow or load, an operating state, a duration, a tariff or conversion cost, and the associated treatment or discharge cost.
Labor cost depends on tasks, not the automation label
Count the people needed to run the complete shift, not only the operators shown beside the filler. Tasks can include material receiving, preform or bottle supply, cap and label replenishment, quality checks, packing, pallet movement, sanitation, maintenance response, warehouse handling, line clearance, supervision, and recordkeeping.
Build a task-by-shift table with role, headcount, paid hours, wage and burden rate, overtime, relief coverage, and training. An automatic line can reduce repetitive handling while increasing the need for technicians who can diagnose sensors, drives, controls, pneumatics, and process faults.
Compare labor-saving investments using the task hours they remove, the new skills they require, the maintenance they add, and the verified saleable output they protect. Total plant labor also includes material handling, quality, sanitation, maintenance, warehouse, and supervisory work.
Maintenance and downtime belong in the base model
Maintenance cost includes planned parts, lubricants, calibration, service, and labor as well as breakdown repairs. Ask for a recommended spare-parts list with quantity, price, lead time, failure consequence, and equipment reference. Separate commissioning spares, routine consumables, wear parts, and strategic critical parts.
Downtime affects unit cost through the denominator. If the plant pays for labor, rent, and depreciation while output falls, cost per saleable bottle rises even when material cost is unchanged. Model planned cleaning, format change, preventive maintenance, and realistic minor stops in the production calendar. Keep unplanned breakdowns as a sensitivity scenario until the plant has reliable history.
Use saleable bottles as the denominator
The denominator should be released product, not nameplate production.
Saleable bottles = bottles entering the production count − process rejects − packaging rejects − quality holds not released − damaged finished goods within the costing boundary
Required steady line rate = required saleable bottles / (scheduled production hours × planned line utilization)
Planned utilization is an operating assumption. It should reflect startup, changeover, replenishment, cleaning, minor stops, quality checks, and downstream congestion. It is not a machine guarantee.
Run at least three scenarios:
|
Scenario
|
Purpose
|
Inputs to change
|
|
Base plan
|
Budget and normal staffing
|
Forecast volume, expected schedule, current quotes, planned utilization
|
|
Low-volume or launch
|
Test cash exposure if sales ramp slowly
|
Lower released volume, smaller orders, more changeovers, similar fixed overhead
|
|
High-demand or constrained
|
Test bottlenecks and expansion timing
|
More shifts, overtime, utility peaks, maintenance windows, warehouse and packing capacity
|
In the high-demand case, raise output only after checking treatment, bottle supply, cap and label replenishment, packing, pallet handling, laboratory release, utilities, warehouse space, and dispatch.
Compare buying bottles with blowing them on site
The two routes move costs between packaging, capital, utilities, labor, storage, and maintenance.
Buy finished bottles
Include the delivered bottle price, inbound freight, unloading, protected storage, handling damage, inventory financing, supplier minimum order, lead time, and supply interruption risk. This route needs less production equipment but consumes more warehouse volume than preforms.
Blow PET bottles on site
Include preforms, blower, molds, high-pressure compressed air, cooling, conveyors, inspection, operators, maintenance, spare parts, bottle-development trials, and rejects. Add the building and utility capacity required for the blow-molding area.
Use current quotations and the same approved bottle specification for both cases. Compare annual cash cost, capital requirement, storage, staffing, changeover, resilience, and quality responsibility. The result can change with production volume, bottle design, logistics distance, and utility tariffs.
Add the costs that appear after the equipment order
Project overruns often come from scope outside the equipment purchase order:
- freight basis, marine insurance, destination handling, duties, taxes, and customs services;
- unloading, lifting, storage before installation, and movement through factory doors;
- foundations, floor repair, hygienic partitions, drains, ventilation, pipe racks, cable trays, and utility distribution;
- local electrical panels, cables, piping, valves, insulation, supports, and installation consumables;
- travel, visas, accommodation, interpreters, local technicians, temporary utilities, and commissioning materials;
- product, preforms, caps, labels, film, cartons, pallets, chemicals, and laboratory tests for FAT and site trials;
- operator recruitment, training time, startup rejects, repeat testing, punch-list work, and delayed-production exposure.
State the currency, quotation date, tax basis, Incoterm, validity, exchange-rate assumption, escalation basis, payment timing, and contingency ownership for every cost line. Normalize those commercial conditions before comparing totals.
Build a quotation comparison sheet
Request the following from each supplier:
- Equipment list with model, quantity, function, price, and option status
- Supported bottle, cap, label, and pack formats
- Capacity basis and complete-line acceptance criteria
- Utility schedule with operating and peak requirements
- Product-contact materials, cleaning method, and instrumentation
- Layout, access, interconnection lengths, and battery limits
- Molds, change parts, tools, consumables, and recommended spares
- FAT, packing, shipping, installation, commissioning, training, and documentation scope
- Warranty and service terms, exclusions, response method, and chargeable items
Normalize the quotes into the same cost categories. Mark a missing line item "excluded" or "price pending"; a blank cell is an unresolved cost, not zero.
Finish the cost model
A useful bottled water production cost model is traceable. Every amount should point to a dated quote, tariff, payroll input, engineering calculation, or documented assumption. Every denominator should point to a production schedule and released-output calculation.
Before requesting an equipment proposal, send MIC Beverage Machine the raw-water analysis, bottle and cap specification, target saleable output, final pack, factory drawing, utility conditions, and scope boundary. That information allows a line configuration and utility schedule to be priced on a defined basis.
FAQ
How much does it cost to start a bottled water plant?
Calculate the amount from the water source and treatment, container route, line output, automation, final pack, building work, utilities, location, freight, duties, installation, and regulatory requirements. Current quotations produce a project-specific installed-cost estimate.
What is normally the biggest bottled water production cost?
Identify the largest category from the package, market, plant scale, and accounting boundary. For a single-use PET project, calculate the preform or bottle, cap, label, and secondary pack first, then test utilities, labor, rejects, maintenance, and fixed-cost absorption against actual quotations.
How do I calculate cost per bottle?
Divide the operating costs for a defined period by the saleable bottles released during that period. Keep capital recovery, depreciation, financing, sales, and delivery costs in clearly labeled lines so the result is not confused with factory conversion cost.
Is buying a cheaper filling machine the best way to reduce cost?
A cheaper option reduces cost when it meets the same product, package, hygiene, output, utility, safety, service, and acceptance requirements. Missing equipment, higher labor, more rejects, difficult maintenance, or lower saleable output can offset the lower purchase price.
Should I buy empty bottles or blow PET bottles in the plant?
Compare both routes with the same bottle specification and annual production scenarios. Include capital, preforms or delivered bottles, freight, storage, high-pressure air, cooling, labor, molds, maintenance, rejects, supply risk, and the value of production flexibility.